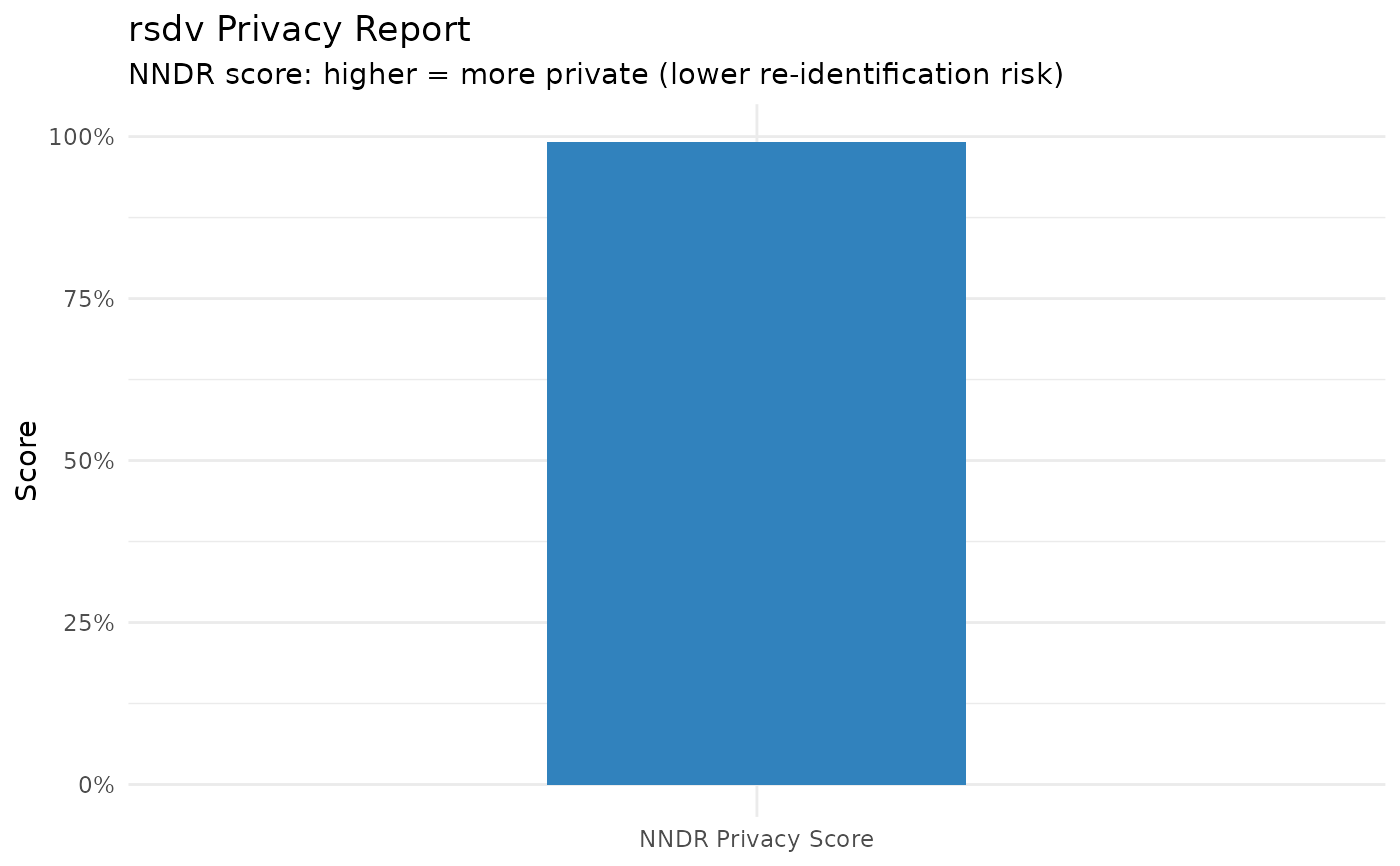
Plots the NNDR score as a gauge-style bar.
Examples
# \donttest{
syn <- gaussian_copula_synthesizer(metadata(adult_income)) |> fit(adult_income)
synth <- sample(syn, n = 500)
pr <- privacy_report(adult_income, synth)
ggplot2::autoplot(pr)

# }
# }
Plots the NNDR score as a gauge-style bar.
# \donttest{
syn <- gaussian_copula_synthesizer(metadata(adult_income)) |> fit(adult_income)
synth <- sample(syn, n = 500)
pr <- privacy_report(adult_income, synth)
ggplot2::autoplot(pr)
# }